Your catalogue has an audience your deals don't reach.
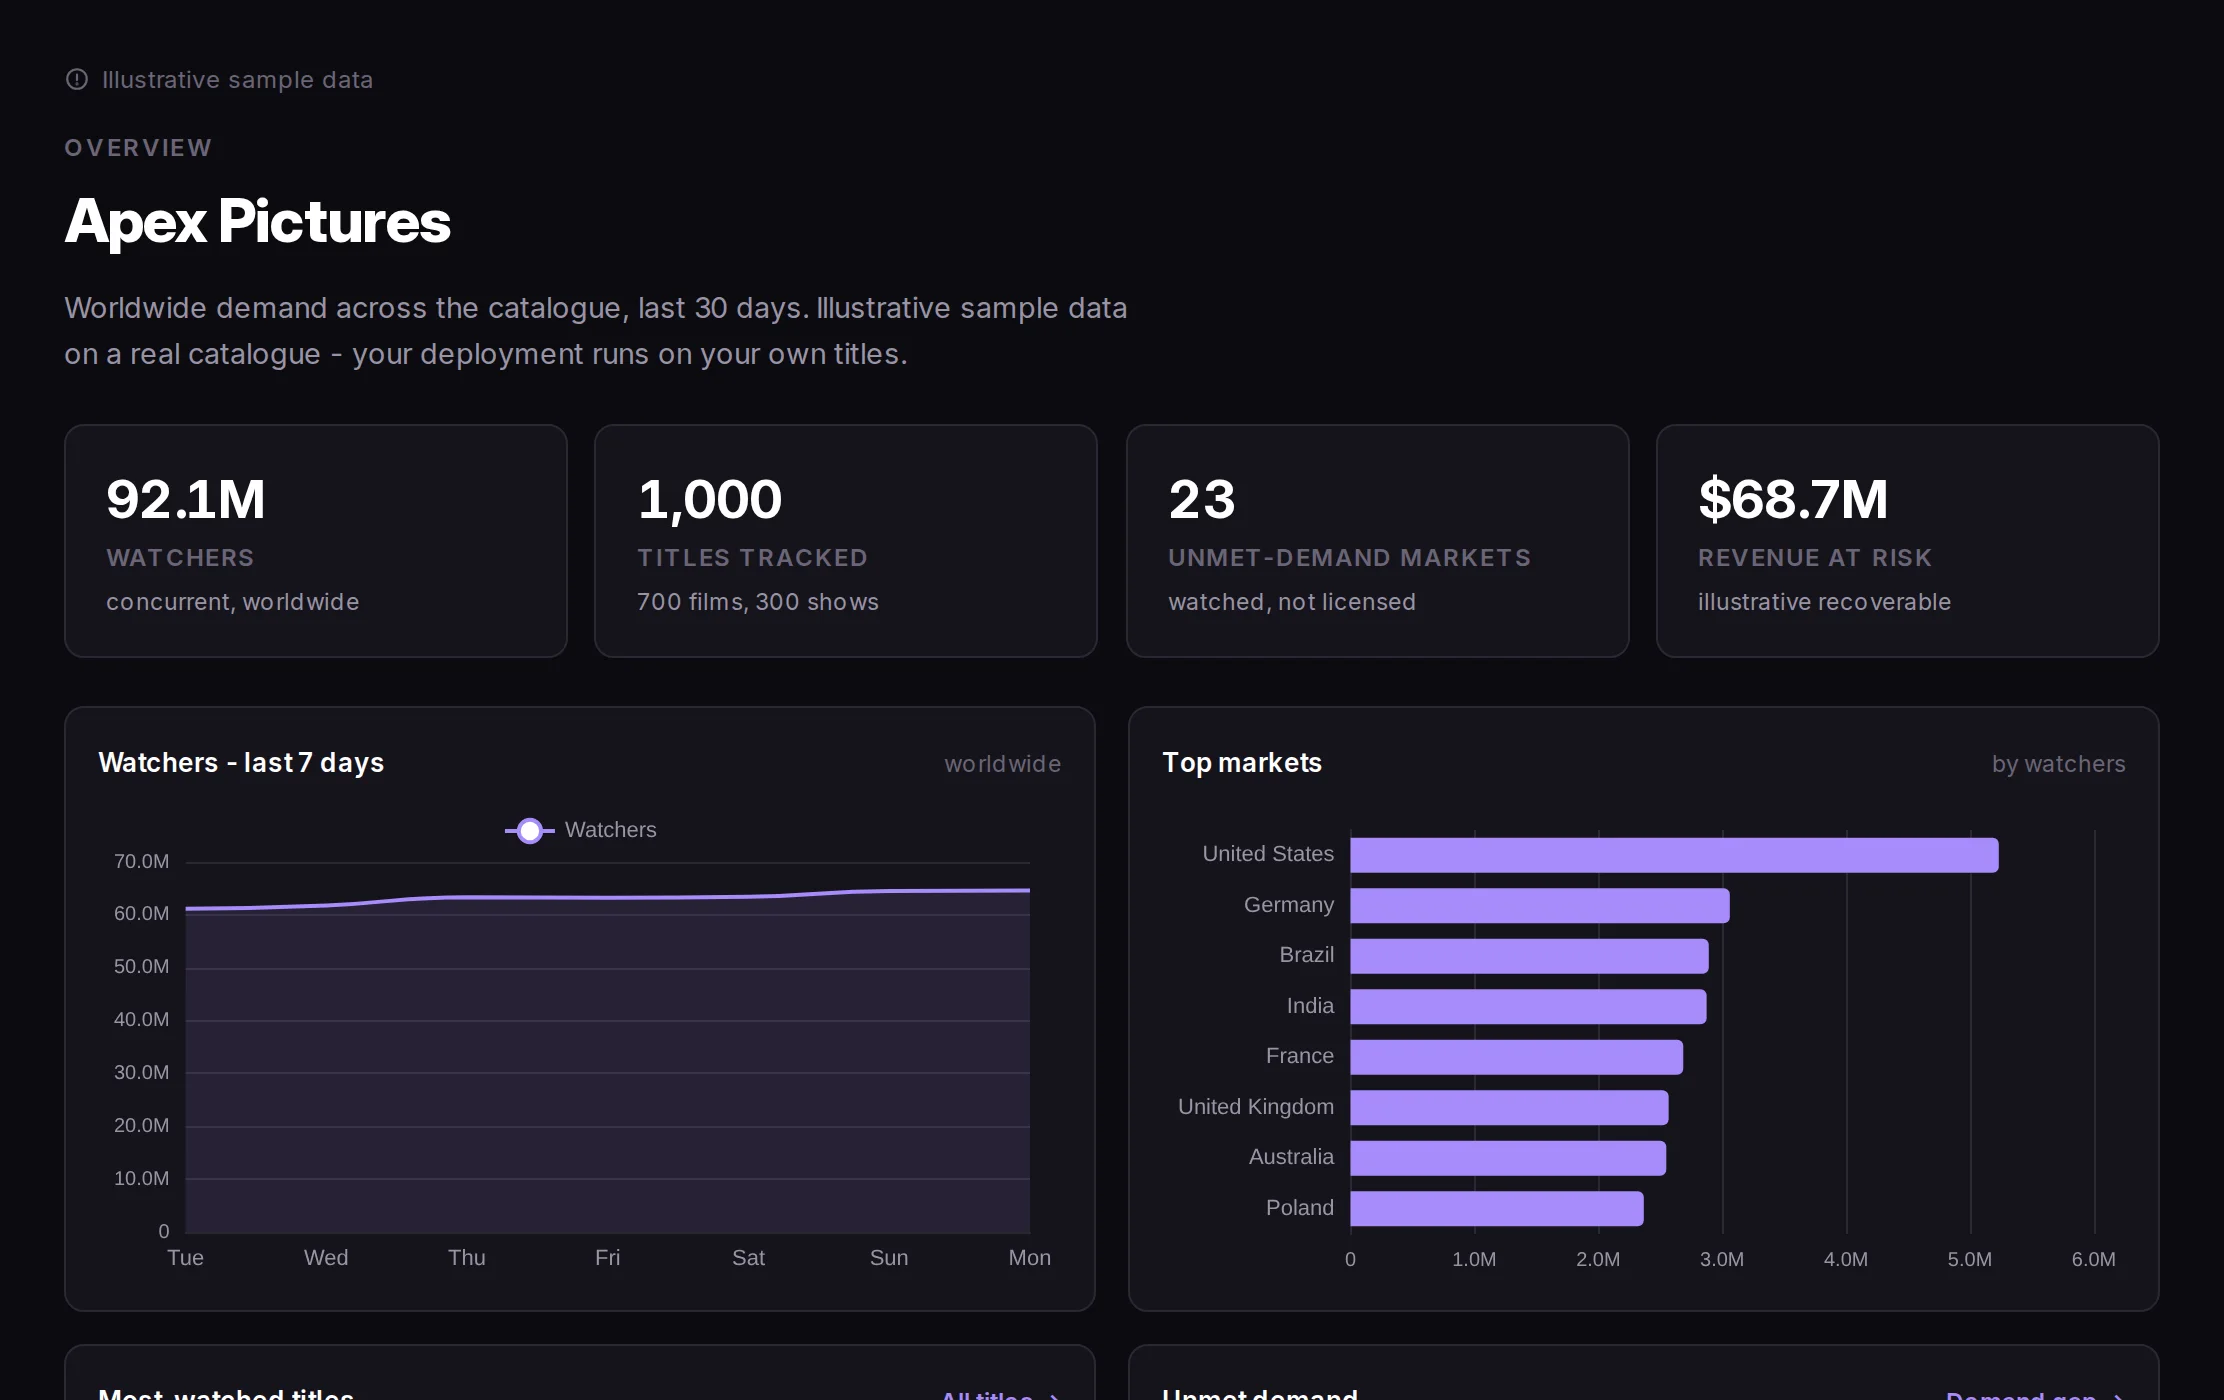
We put a dollar figure on the demand your streaming numbers never show, by title and by market.
Tracking demand for 1K+ titles across 195 markets, updated daily.
The blind spot
Licensed data shows what people paid for. Not what they want.
Box office and streaming only count what your release schedule already made available. They are silent on the markets where you hold no deal, the windows that have not opened, and the services you do not sell to.
That demand is real and measurable. Right now your windowing, licensing and protection calls are being made without it, and the missed market never reaches the agenda.
The stakes
Watched everywhere. Paid for almost nowhere.
Independent industry estimates from Kearney and MUSO. We turn that industry-wide gap into a specific number for your own catalogue.
What you get
Four outputs. Each one changes a conversation you are already having.
- 01 Revenue at riskWorldwide demand converted to dollars, by title and by territory.
- 02 Unmet demand, sizedRevenue sitting in markets where you have no active deal, sized, ranked and ready to take into a territory conversation.
- 03 Demand mapWhere every title is being watched, by market and over time.
- 04 Window timingWhere a window bled revenue: titles that peaked before the streaming window opened, markets where theatrical was over before the release reached them.
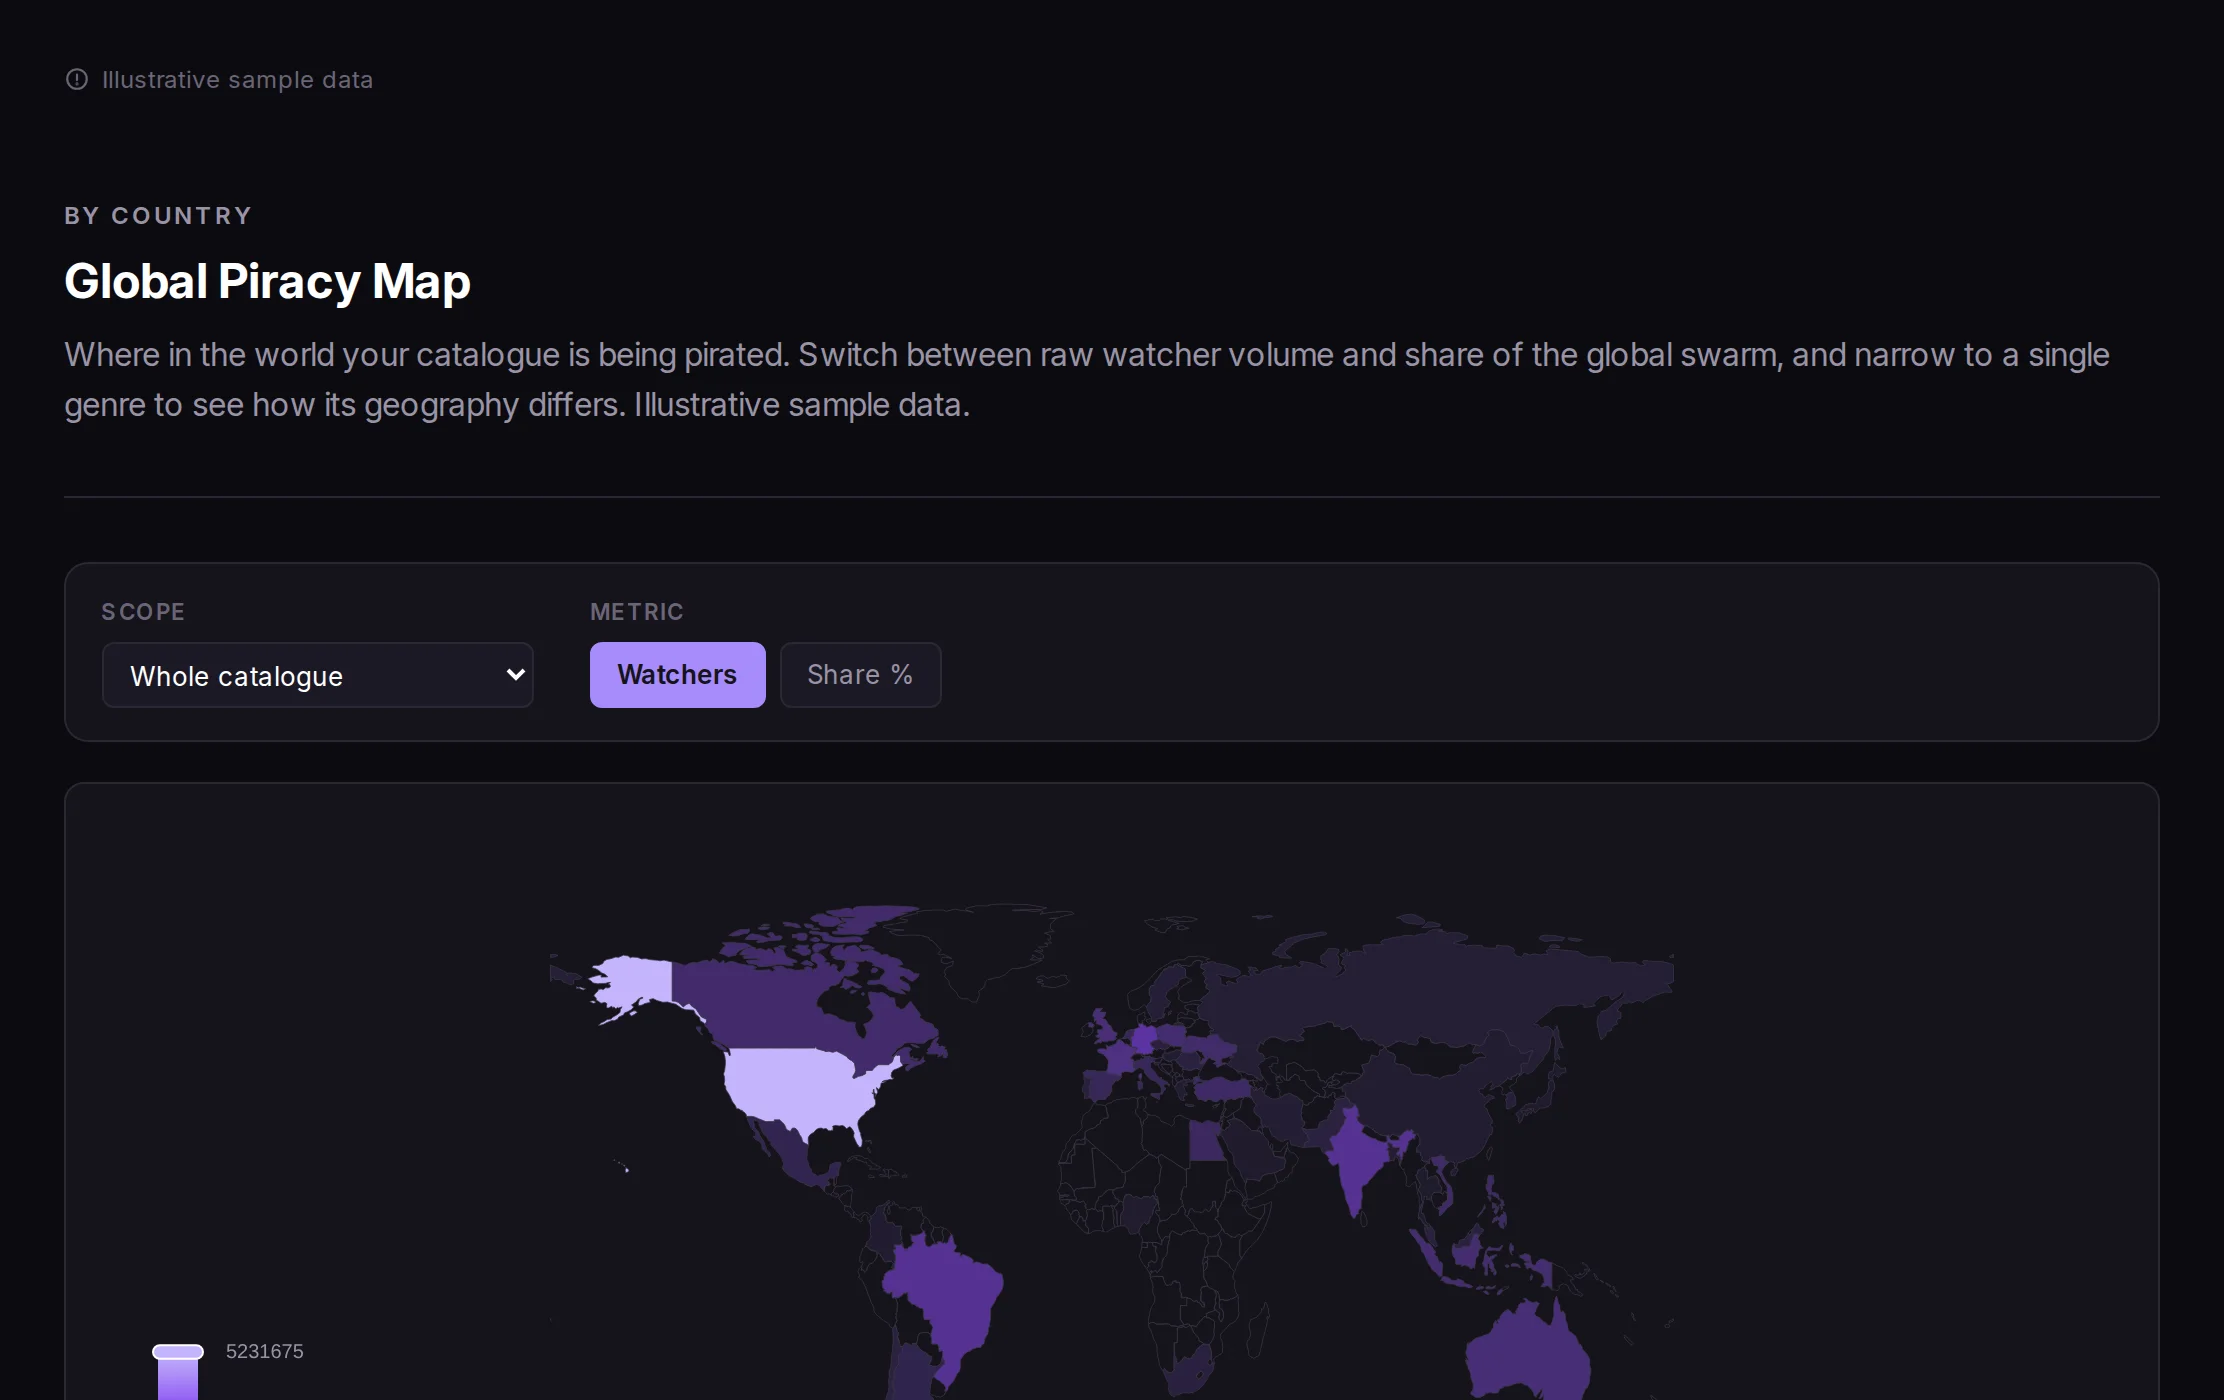
Most catalogues have a high-demand market with no deal in place. Find yours.
Who it's for
Three teams. One number each is flying blind on.
Distribution & licensing
Walk into windowing and territory talks knowing where the demand is and what it is worth. Find licensing white space you had written off.
See the licensing demand gapContent protection
See within hours when a title leaks and where exposure concentrates. Aim enforcement at the releases that move the number, not the noise.
See the takedown queueStrategy & finance
The board is already asking what the catalogue is worth in markets you do not serve. Today the answer is an estimate. We make it a number, title by title, benchmarked against the market.
See the leaderboardQuestions
Questions we hear from distribution and protection leads.
We already have an anti-piracy team.
Good. This makes them sharper. It ranks where exposure concentrates so enforcement hits the highest-impact releases first, and it gives protection, distribution and finance one shared picture of demand to take into budget and strategy conversations.
Where does the data come from?
We aggregate millions of demand signals from multiple data brokers, across 195 markets and refreshed daily, resolved to your titles and reported as aggregates.
Can we see our own catalogue first?
Yes. The pilot runs an exposure report on a slice of your own catalogue before any commitment, so you can judge the data quality yourself.
The pilot runs on your own catalogue.
We pull a revenue-at-risk analysis for a slice of your titles before any contract is signed. No integration, no internal resource required. You see what the data shows for your catalogue, then decide if it is worth a conversation.